Lithuania Hits New Solar Peak as Renewables Meet 85% of Demand
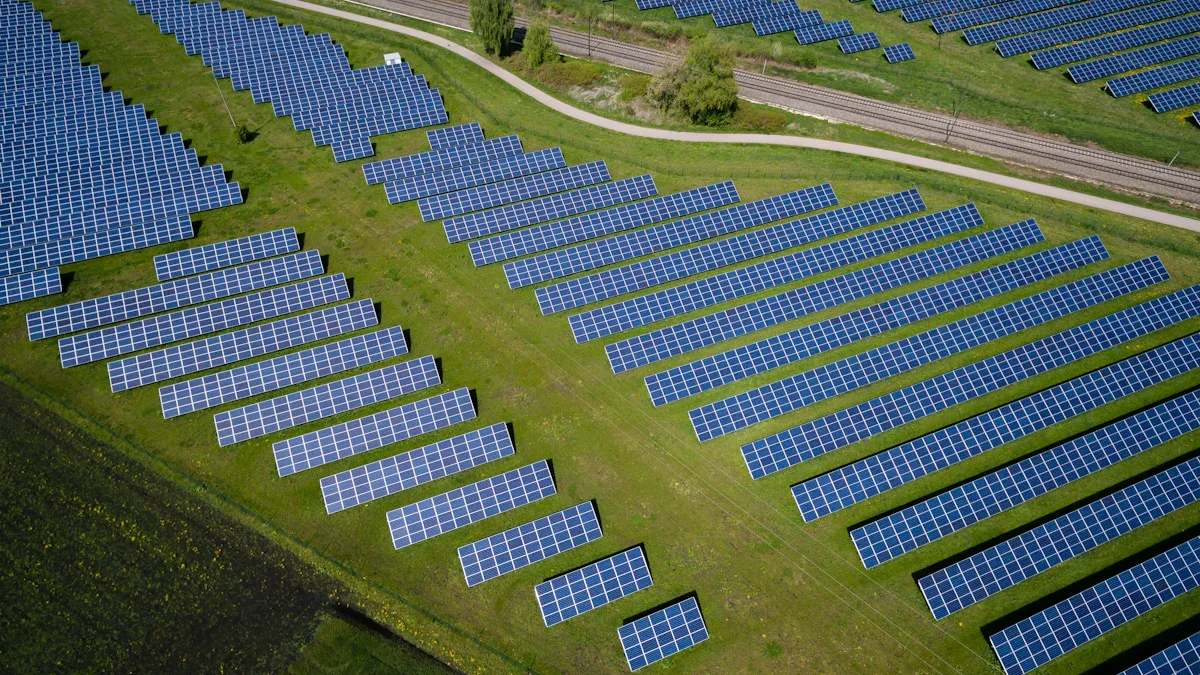
Lithuania reached a significant milestone in its energy transition last week, with domestic production covering 85% of the country’s total electricity needs. This surge in self-sufficiency was driven by a record-breaking performance from the nation’s solar sector, which surpassed previous generation peaks by a substantial margin.
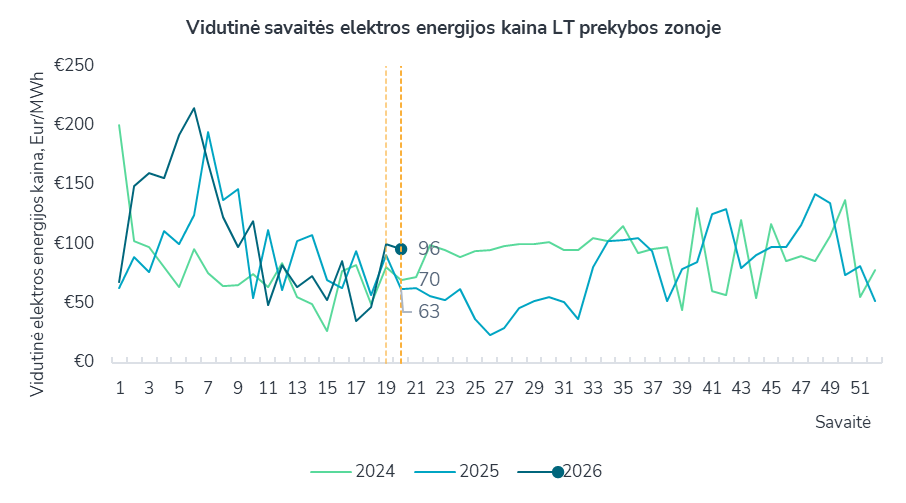
Between May 11 and May 17, the average wholesale electricity price in the Lithuanian zone of the Nord Pool exchange dropped by 4%, falling from €100 per MWh to €96 per MWh. While this reduction reflects a growing supply of cheap renewable energy, it also highlights a persistent price gap within the Baltic region; during the same period, Estonia enjoyed a significantly lower average price of €76 per MWh.
A Record-Breaking Solar Performance
The most striking data point from the week was recorded on Friday between 12:30 and 12:45 PM. During this fifteen-minute window, Lithuania’s solar power plants generated 1,547 MW of electricity. This figure represents a 112 MW increase over the previous record of 1,435 MW.
Paulius Kozlovas, Head of the Strategy Department at Litgrid, the Lithuanian electricity transmission system operator, attributes this growth directly to the rapid expansion of installed solar capacity across the country. As more businesses and households adopt solar technology, the grid’s peak capacity continues to shift upward, fundamentally altering the nation’s energy profile.
Breaking Down the Generation Mix
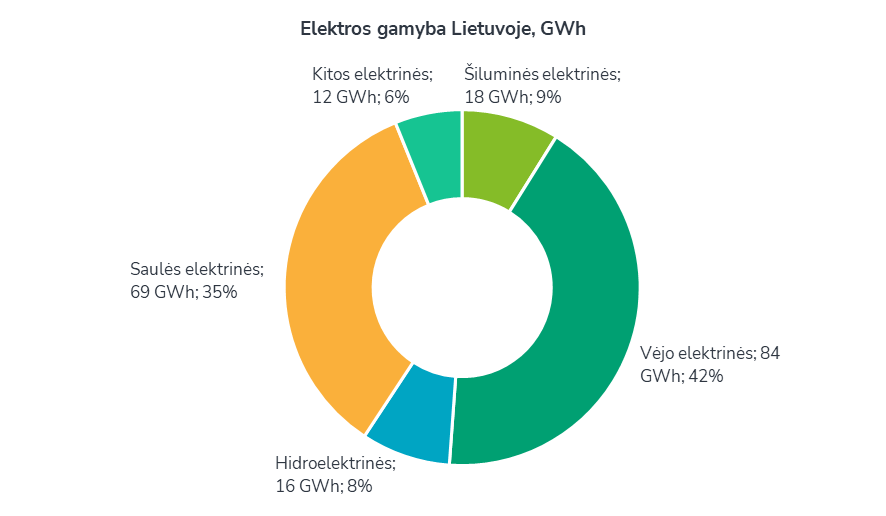
While solar grabbed the headlines with its record-breaking peak, wind energy remained the primary workhorse of the Lithuanian grid. Despite a 23% week-on-week decrease in wind generation due to weather conditions, it still accounted for the largest share of domestic production.
| Energy Source | Share of Total Local Production |
|---|---|
| Wind Power | 42% |
| Solar Power | 35% |
| Thermal Plants | 9% |
| Hydroelectric | 8% |
| Other Sources | 6% |
Total domestic production reached 200 GWh, while national demand stood at 234 GWh. The 85% coverage by local sources is a testament to the country’s strategic pivot away from energy imports, particularly as it seeks to decouple entirely from historical dependencies on Eastern neighbors.
Market Dynamics and Regional Connectivity
The data reveals that while Lithuania is producing more of its own power, it remains deeply integrated into the broader European market. Total imports rose by 21% last week to 88 GWh. The distribution of these imports underscores the importance of regional infrastructure:
* Latvia: 52% of imports
* Sweden (via NordBalt): 42% of imports
* Poland (via LitPol Link): 6% of imports
Conversely, Lithuania also increased its exports by 10%, sending 65 GWh to neighboring markets, with Sweden and Poland being the primary recipients. This two-way flow is facilitated by high-capacity interconnectors like the LitPol Link, which operated at 74% capacity toward Poland, and the NordBalt subsea cable to Sweden.
The Realities of the Green Transition
These figures prove that Lithuania is successfully scaling its renewable infrastructure, but they also serve as a reminder of the complexities of a green grid. The 4% drop in demand (from 240 GWh to 234 GWh) helped ease price pressures, but the intermittent nature of wind and solar means that imports and thermal plants still play a critical role in balancing the system when the sun isn’t shining or the wind isn’t blowing.
Furthermore, the price disparity between Lithuania and Estonia suggests that infrastructure bottlenecks or differing generation mixes within the Nord Pool market continue to impact local costs. For residents and businesses, the record solar generation is a positive signal for long-term energy security, but wholesale prices remain sensitive to the broader European energy climate and the availability of cheap imports from the Nordic countries.
Source: ELTA
Source check Energy Data Verification
This report is based on official weekly operational data from Litgrid, the Lithuanian electricity transmission system operator.
- Confirmed solar generation peak of 1547 MW against Litgrid historical data.
- Verified Nord Pool wholesale price trends for the Lithuania bidding zone.
- Cross-referenced energy mix percentages with regional transmission reports.
- Source
- elta
- Scope
- Lithuania
- Updated
- 2026-05-18 10:33
Source check
Report a trust issue
Send a clear signal to community moderation if the source, facts or context need review.


Comments